
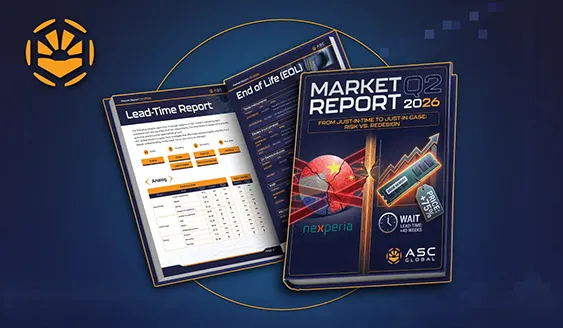
Receive Your Market Report
Get the latest PDF version of the report, all future reports, occasional surveys, and special offers delivered right to your inbox.

For information on our commitment to protecting your privacy, please review our Privacy Policy.
Lead TImes
EOL Reports
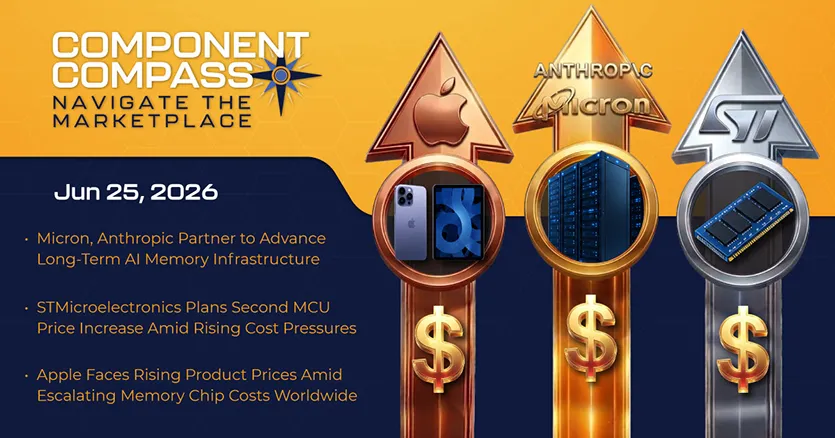
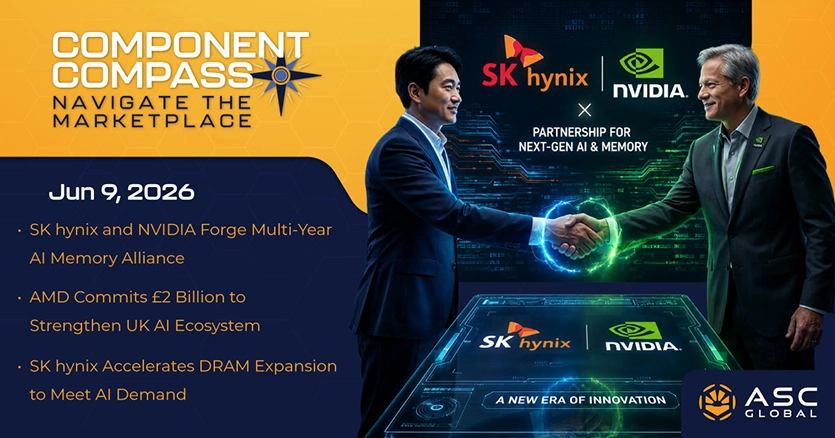
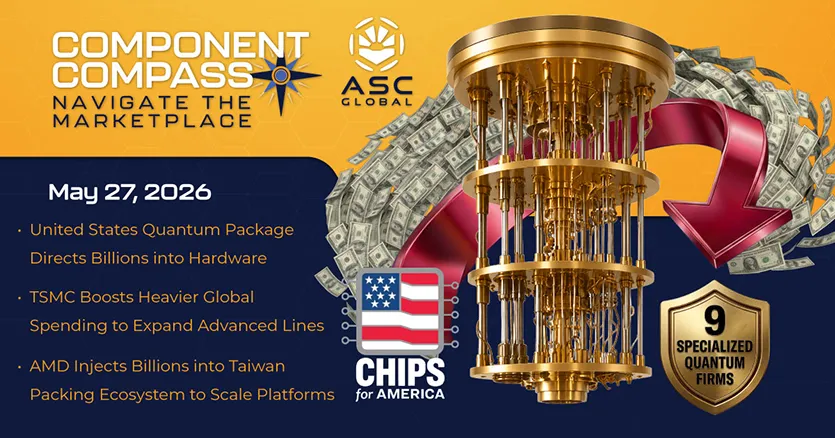
News Flash
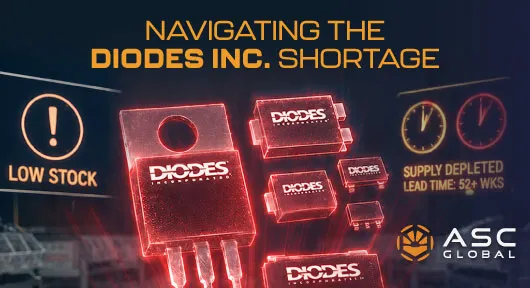
Testing Analysis
Earning Recap
Products & MFRS
LEAD TIMES
We cover the current lead times and pricing trends for Analog, Power, Passive, Memory, Logic & Digital, and Electromechanical components.
END-OF-LIFE REPORTS
We highlight the EOL components from major brands, helping companies manage obsolescence and plan for replacements.
AI Infrastructure Triggers
"Memory Supercycle"
and Global Supply Chain Realignment
The rapid expansion of Artificial Intelligence (AI) and a deepening operational crisis at Nexperia are reshaping procurement strategies for 2026 and beyond.

The "Memory Supercycle"
and Production Cannibalization
As of April 2026, the memory market has transitioned from a shortage into a state of structural scarcity. High Bandwidth Memory (HBM) and Enterprise SSD production have effectively "cannibalized" lines previously dedicated to general-purpose DRAM and NAND.
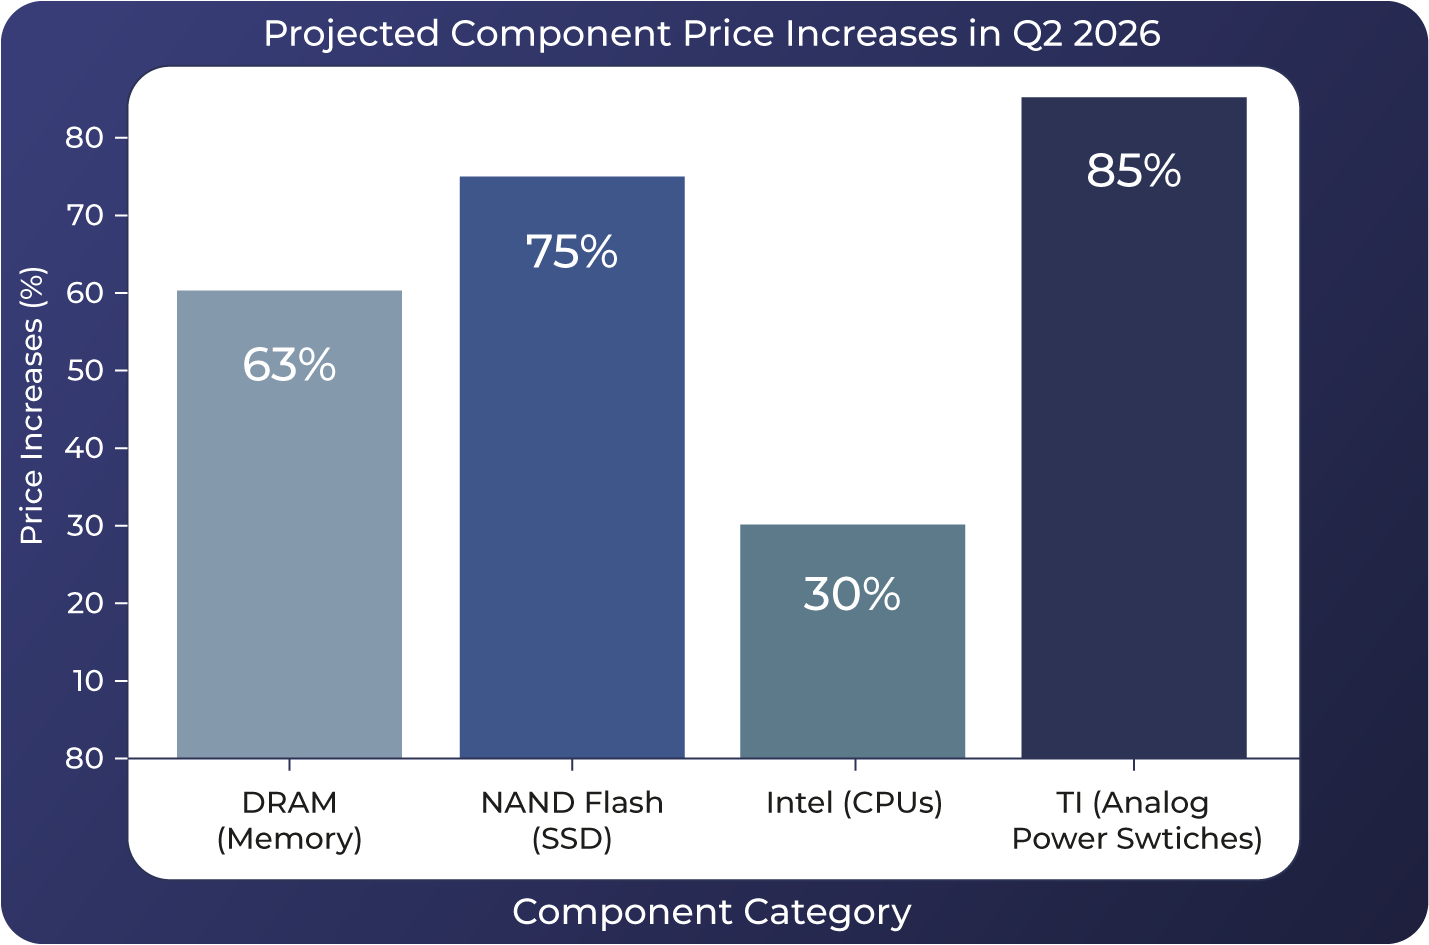
- Unprecedented Price Surges: DRAM contract prices are projected to rise by 58–63% in Q2 2026 alone, while NAND Flash (SSD) prices may surge by up to 75%.
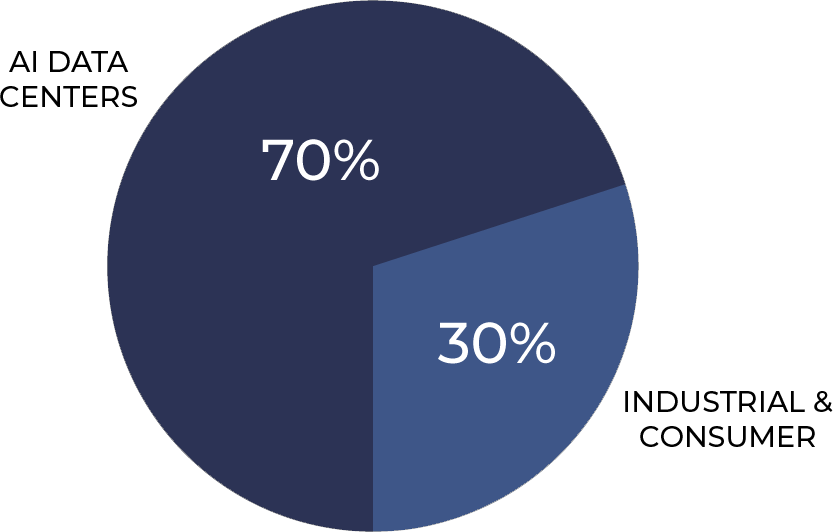
- The 70% Inversion: Analysts now estimate that AI data centers will consume approximately 70% of high-end DRAM in 2026, leaving minimal supply for industrial and consumer sectors.
- Extended Lead Times: Procurement teams are facing lead times of 40+ weeks for high-density RDIMM and enterprise configurations.
Estimated High-End DRAM Consumption in 2026
The Nexperia Crisis:
an Operational "Divorce"
The report identifies a critical supply chain risk involving Nexperia, which has escalated into a near-total operational divorce between its European headquarters and Chinese subsidiary.
- Governance Conflict: In March 2026, Nexperia B.V. (Netherlands) disabled IT access for staff in China, citing unauthorized actions by Chinese management.
- Quality Risks: Nexperia HQ has warned that it cannot validate the authenticity or AEC-Q101 automotive-grade status of components produced in China using non-validated local wafers.
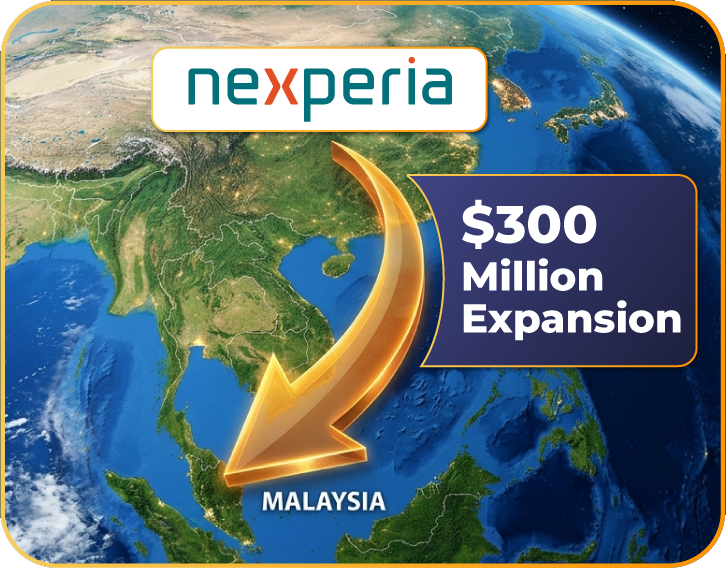
- Global Realignment: Nexperia B.V. is fast-tracking a $300 million expansion in Malaysia to move 90% of global production out of China by mid-2026.
Industry-Wide
Pricing Adjustments
Major manufacturers have announced significant price hikes effective April 1, 2026, to offset rising material and energy costs:
- Texas Instruments: Adjustments of up to 85% for specific analog power switches.
- Intel: CPU price hikes of up to 30% due to supply chain tightening.
- NXP: Broad price adjustments impacting automotive and industrial portfolios.

Strategic Recommendations
for Procurement Leaders
The shortage is no longer just a pricing issue; it is reshaping product lifecycles.
ASC Global recommends that organizations consider Phase Buying, deferring non-urgent purchases until late 2026, and implement Frequent Re-Quoting, as quotes older than 14 days are now considered obsolete due to weekly price adjustments.
TEST & FAILURE RATES
In Q4 2025, diodes and transistors showed the highest failure rates, indicating stress in power and signal paths. MOSFETs followed, while FPGAs and logic ICs required ongoing validation. Memory, MCUs, RF, and power management devices recorded lower but persistent test exposure across industrial and communications systems.
By Device Type
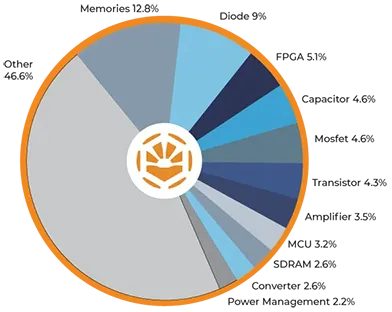
Top 10 Component Types by Failure Rate
| 1. Clock 2. Diode 3. Codec 4. Interface 5. Crystal, Oscillators, Resonators |
6. DC DC Converters 7. Ethernet 8. Transceiver 9. Capacitor 10. DC DC Switching Regulators |
This ranking is determined by the proportion of failed results compared to the total units tested in each category. While some failures stem from aging or mishandling, others could indicate more serious quality issues or potential counterfeit threats
EARNINGS RECAP
This report summarizes the latest earnings results from the biggest brands in electronic components, highlighting key trends and financial insights.
AUTOMOTIVE
Toyota Motor Corp.
- Revenue: $84.51 B (+3.5% YoY)
- Net income: $5.80 B
- Net Profit Margin: 6.9%
Volkswagen Group
- Revenue: $82.10 B (-4.7% YoY)
- Net income: $2.31 B
- Net Profit Margin: 2.8%
Tesla, Inc.
- Revenue: $23.15 B (-7.1% YoY)
- Net income: $0.80 B
- Net Profit Margin: 3.4%
PRODUCT UPDATES
MANUFACTURER UPDATES